PQ Charts & Tables
The charts from our most recent Platinum Quarterly publication can be viewed and downloaded here. Find the full report, including commentary and charts, here.
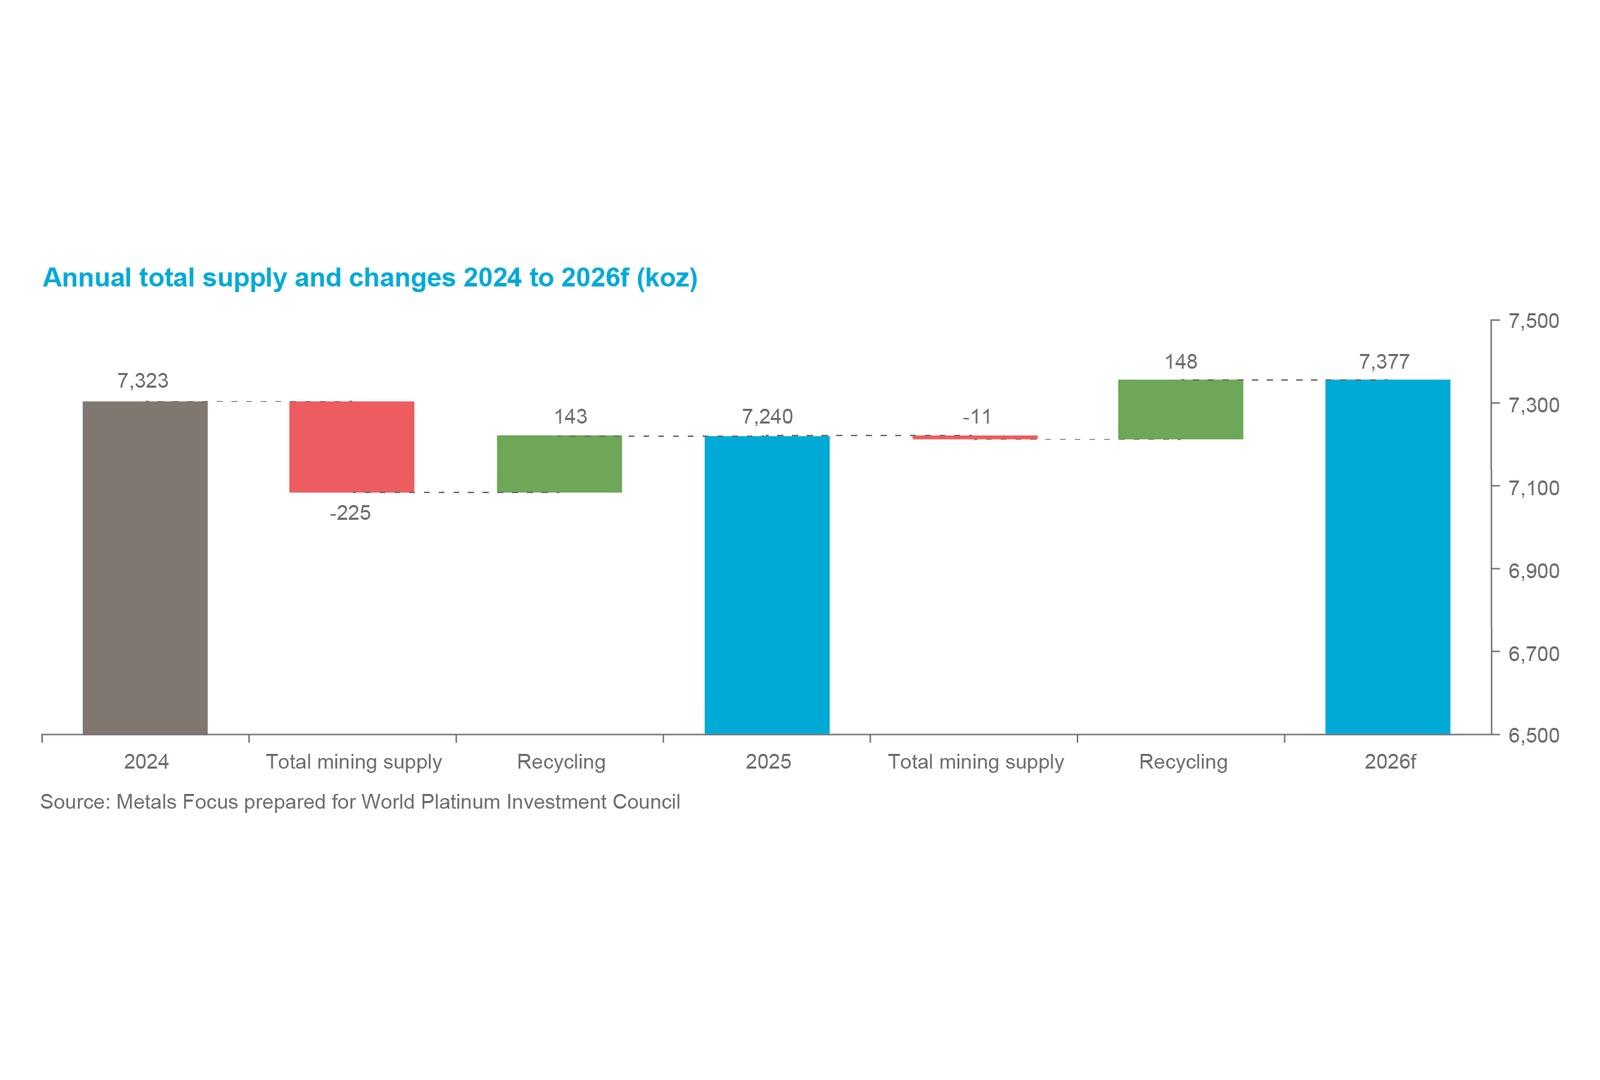
Annual total supply and changes 2024 to 2026f (koz).
Source: Metals Focus prepared for World Platinum Investment Council
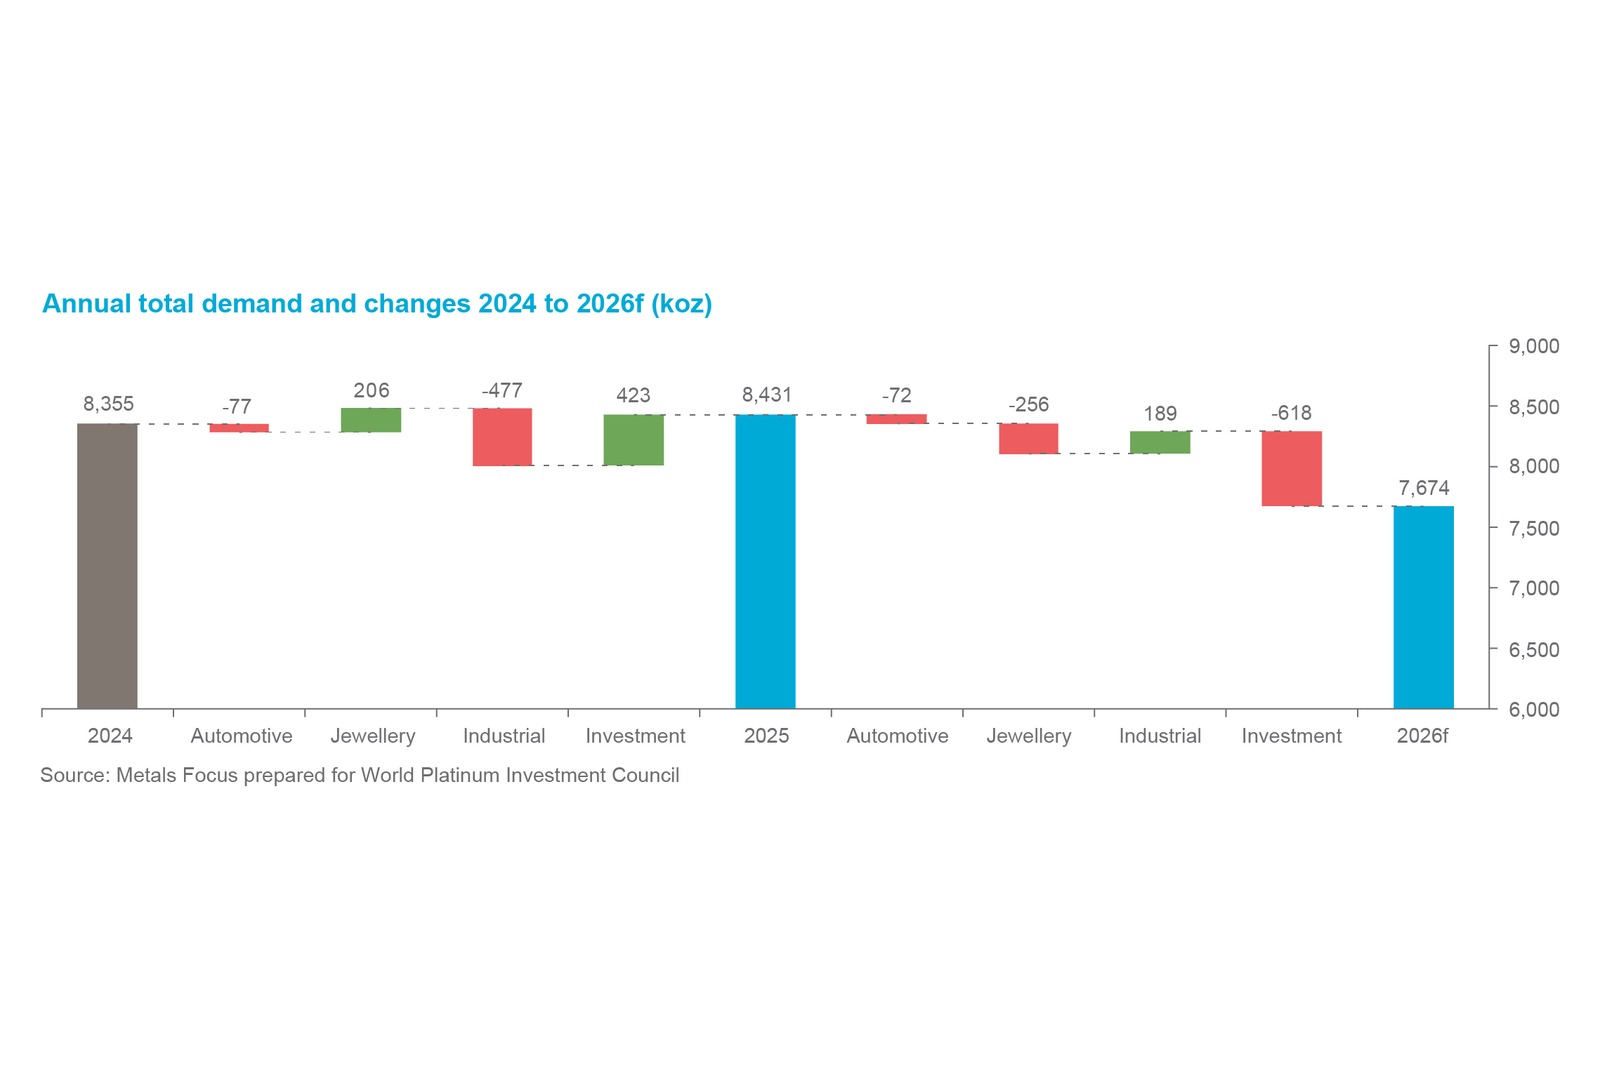
Annual total demand and changes 2024 to 2026f (koz).
Source: Metals Focus prepared for World Platinum Investment Council
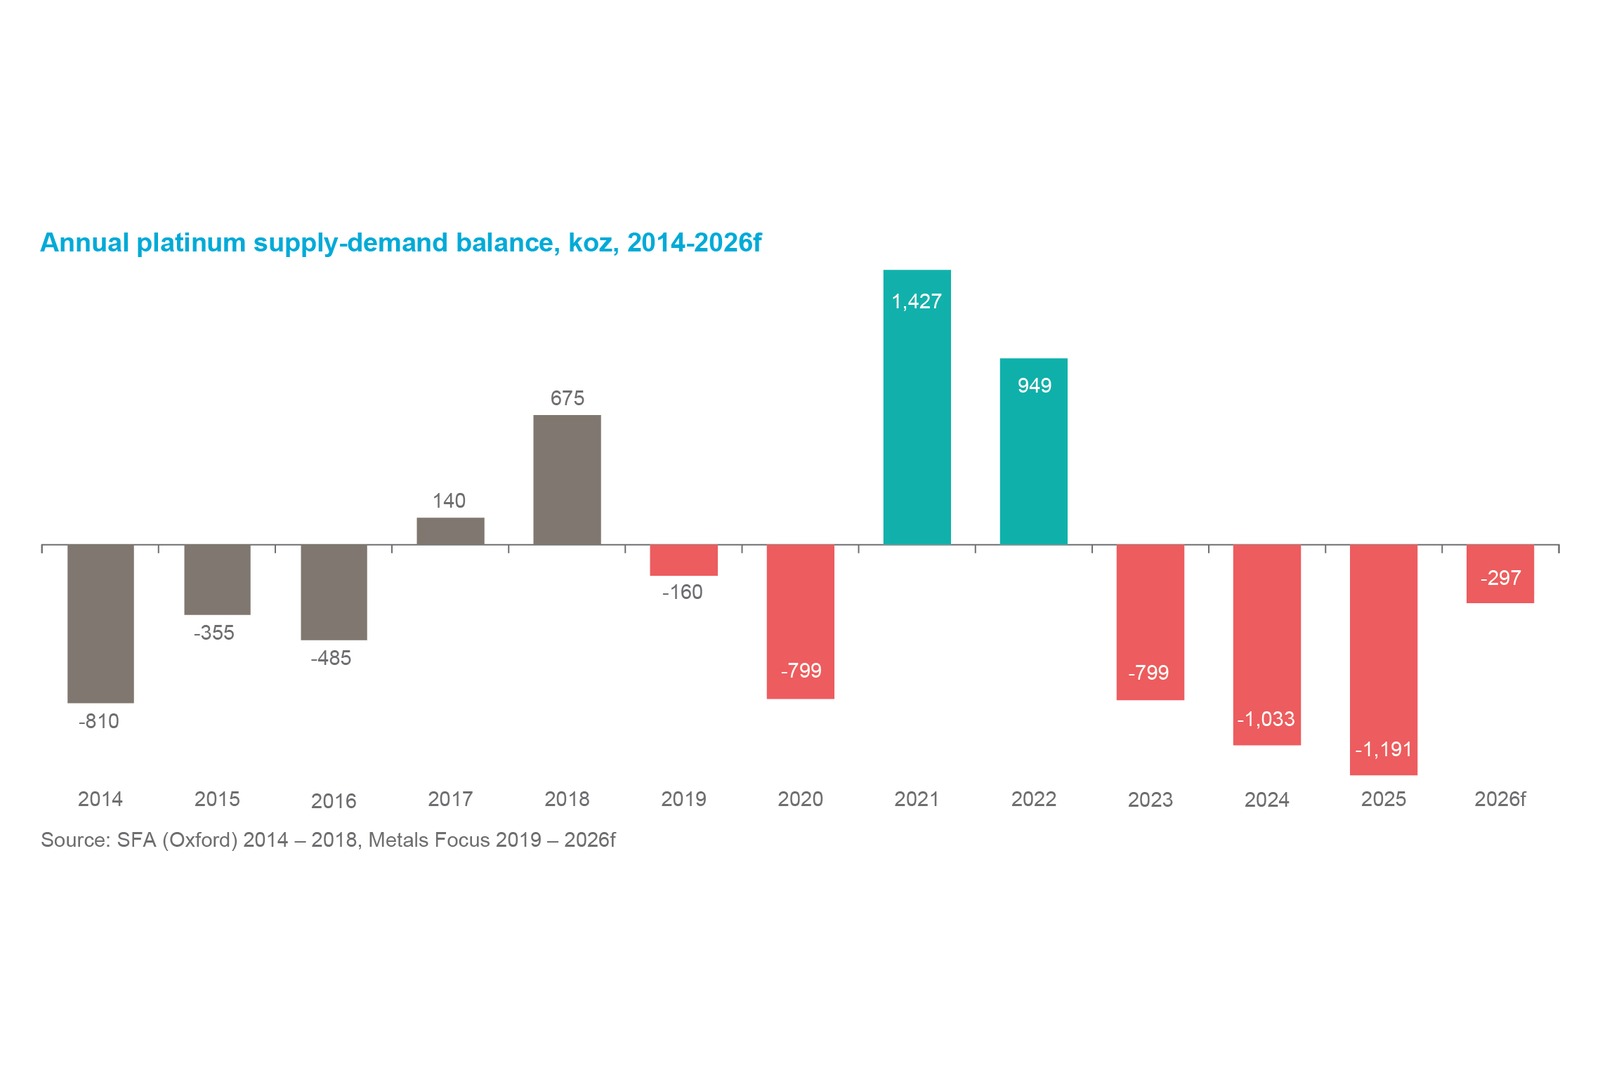
Annual platinum supply-demand balances 2014-2026f (koz).
Source: SFA (Oxford) 2014 – 2018, Metals Focus 2019 – 2026f
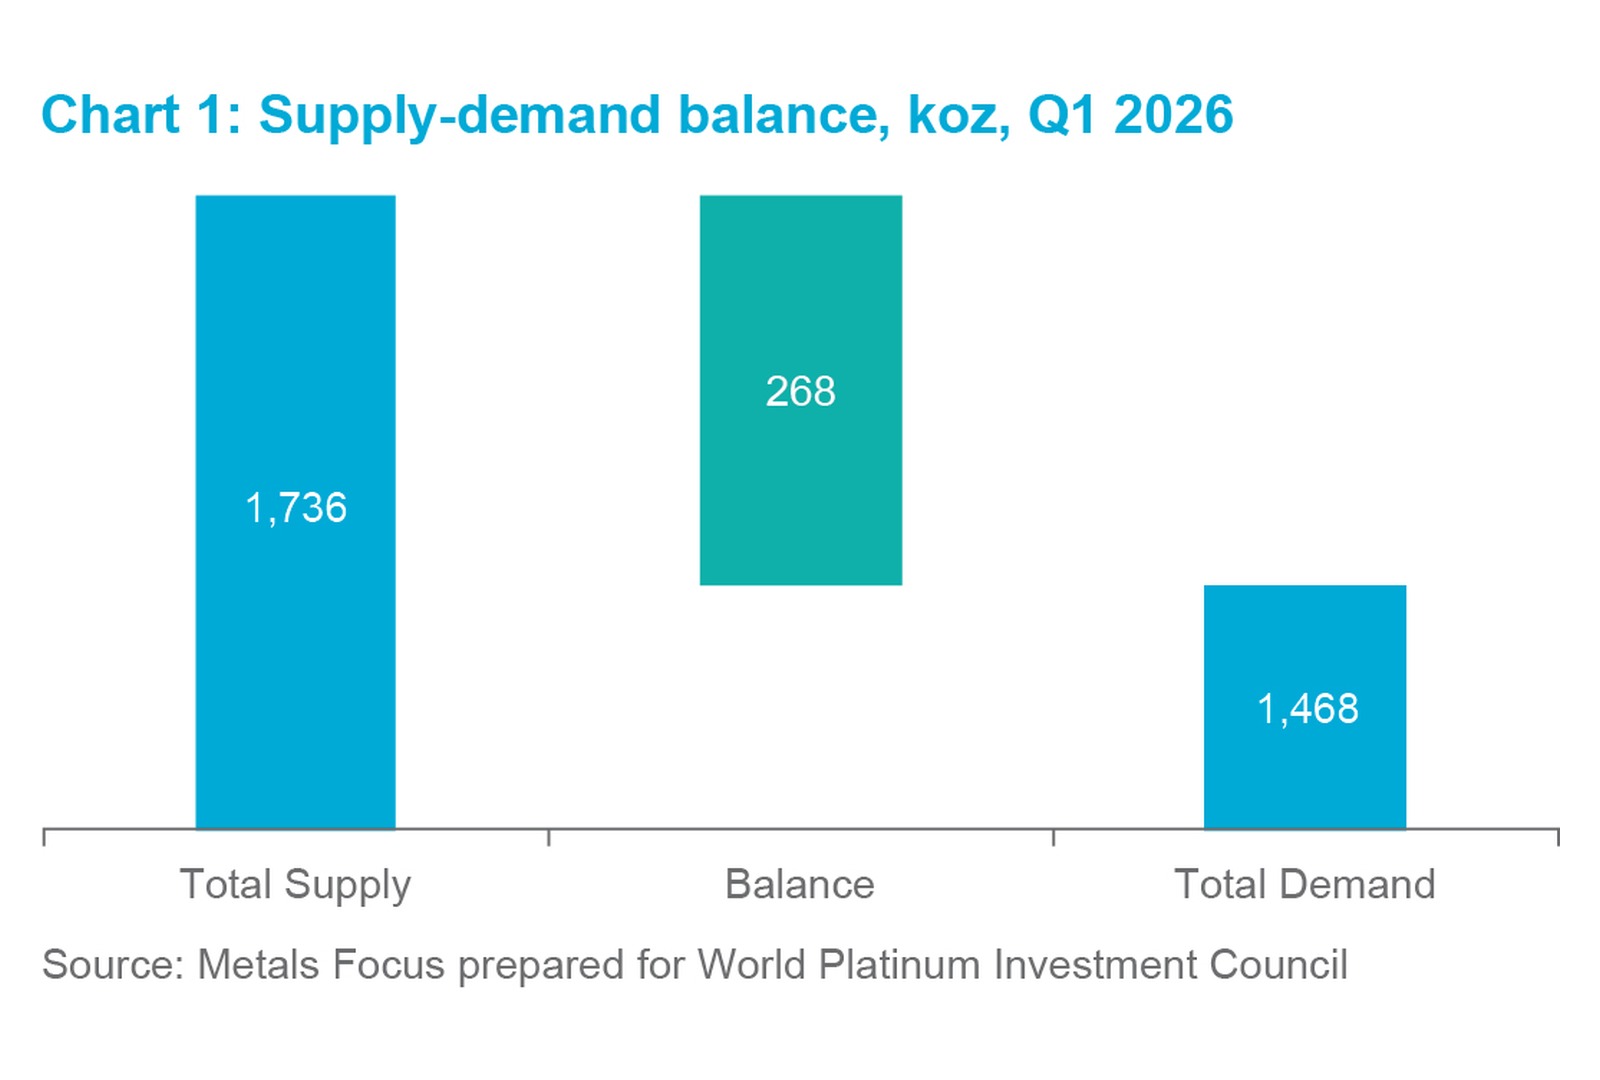
Chart 1: Supply-demand balance, koz, Q1 2026.
Source: Metals Focus prepared for World Platinum Investment Council
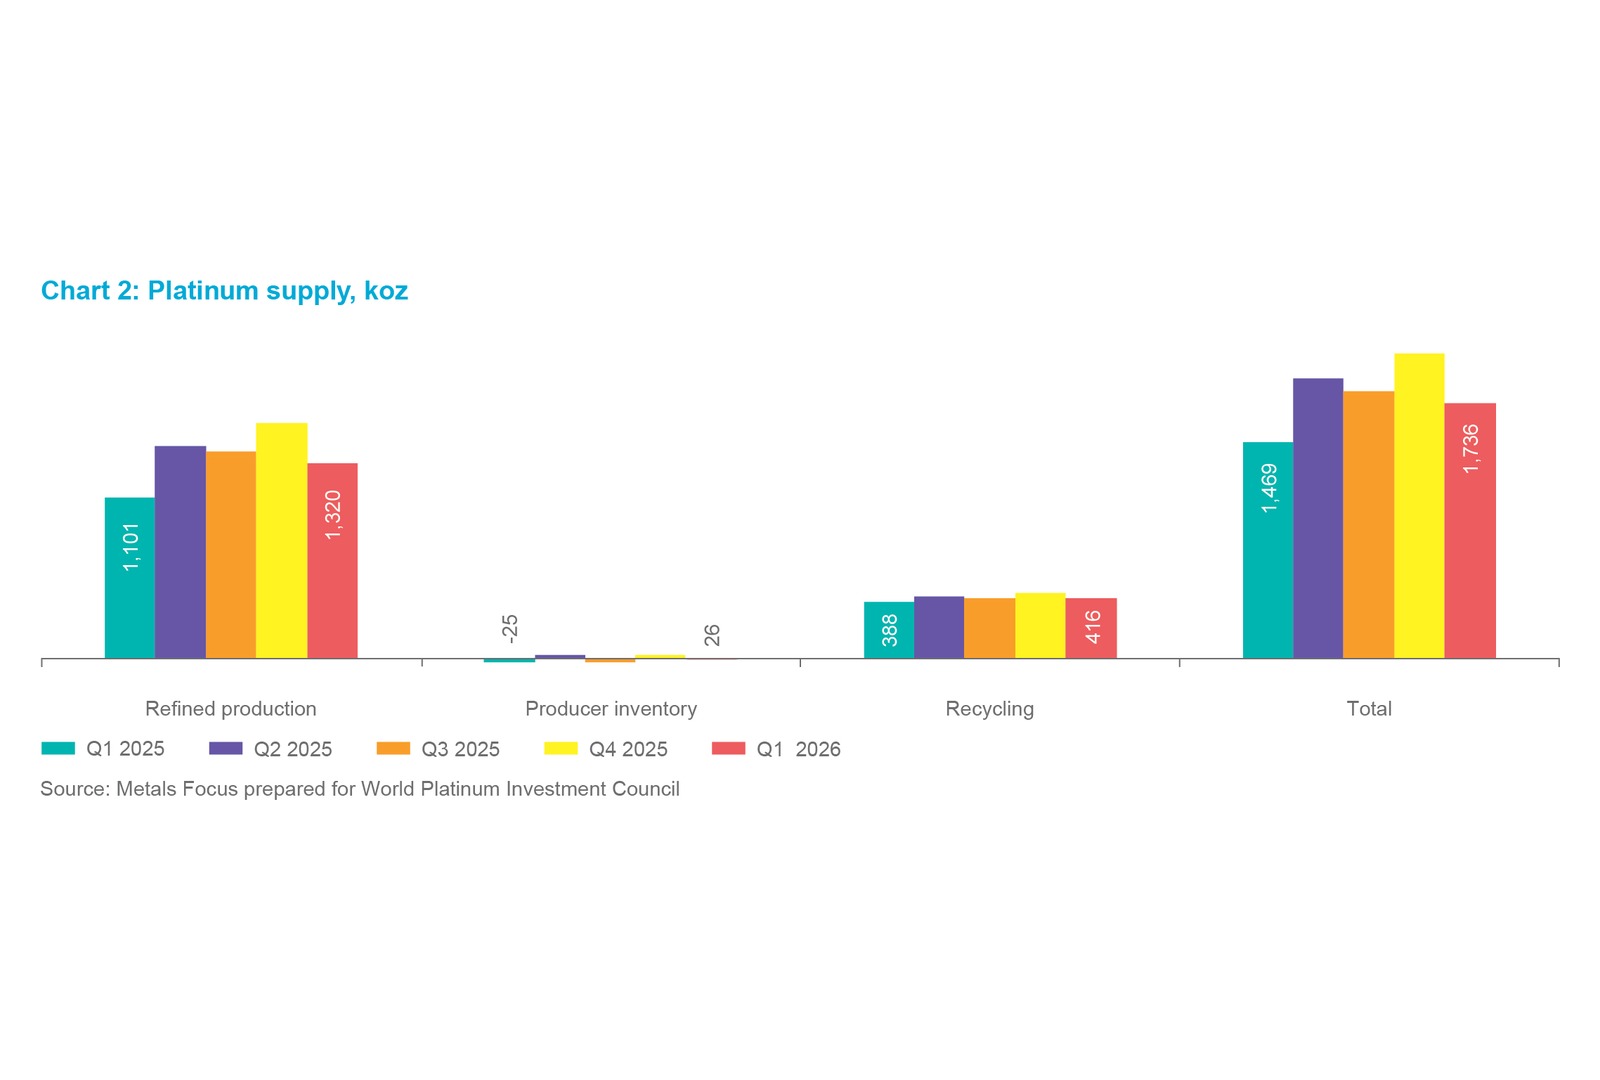
Chart 2: Platinum supply, koz.
Source: Metals Focus prepared for World Platinum Investment Council
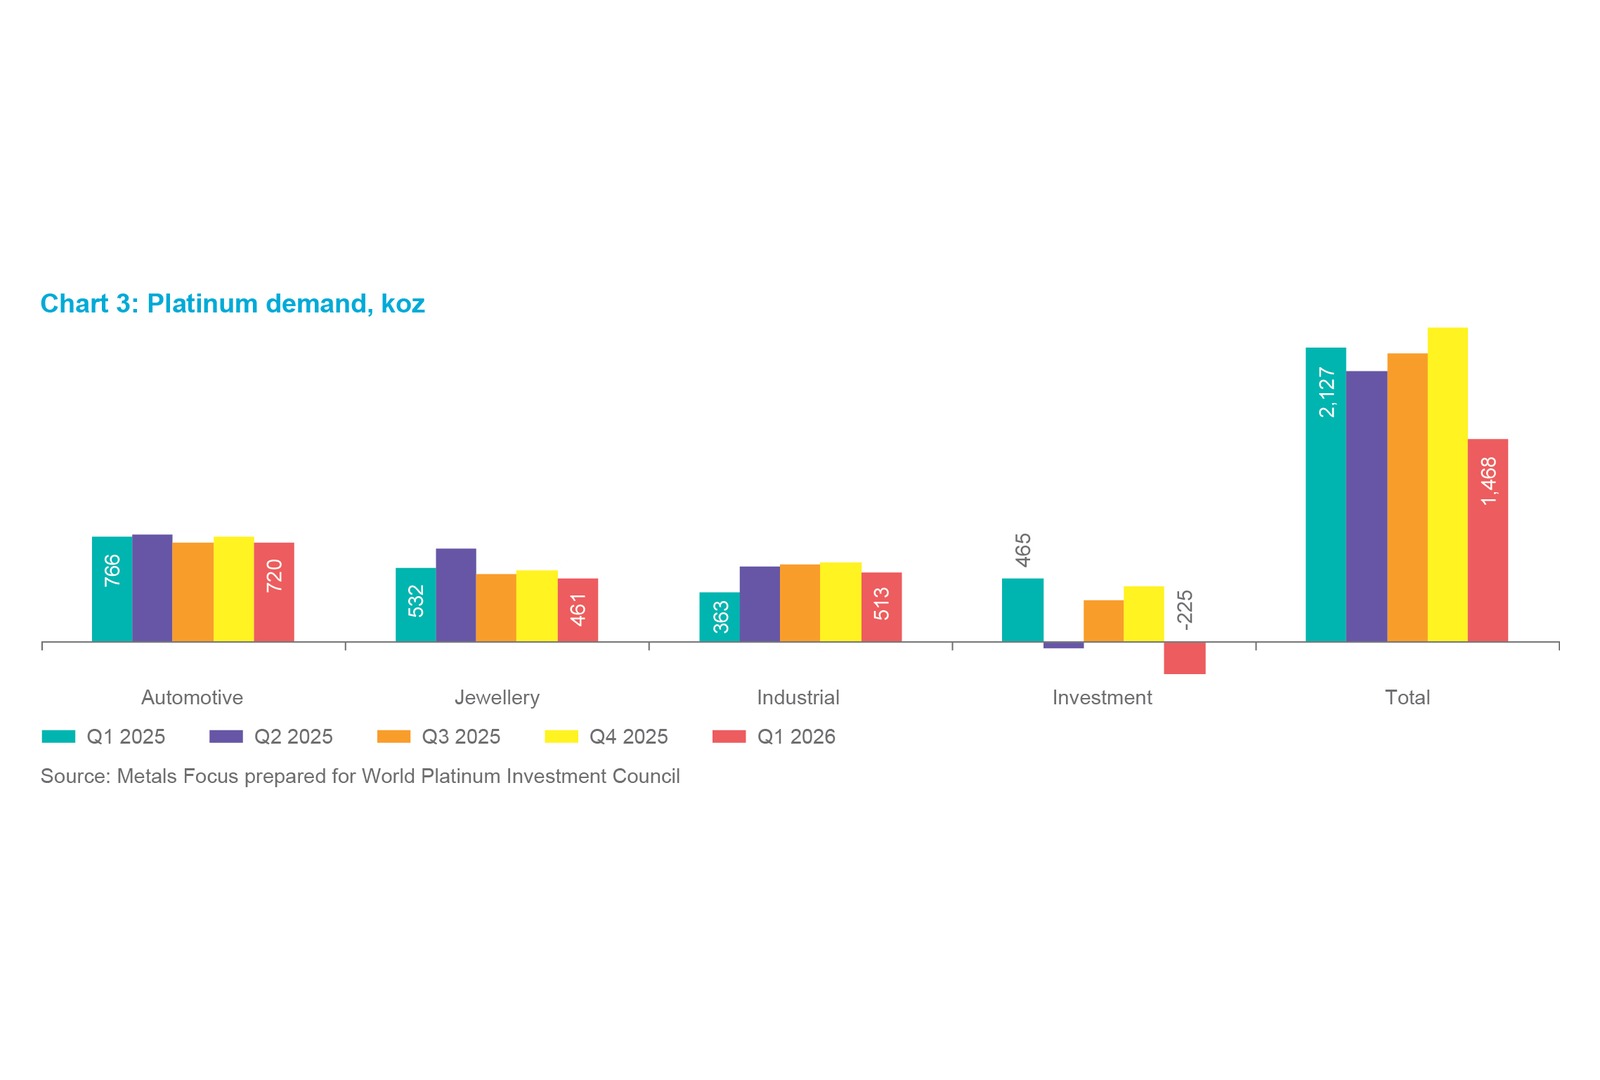
Chart 3: Platinum demand, koz.
Source: Metals Focus prepared for World Platinum Investment Council
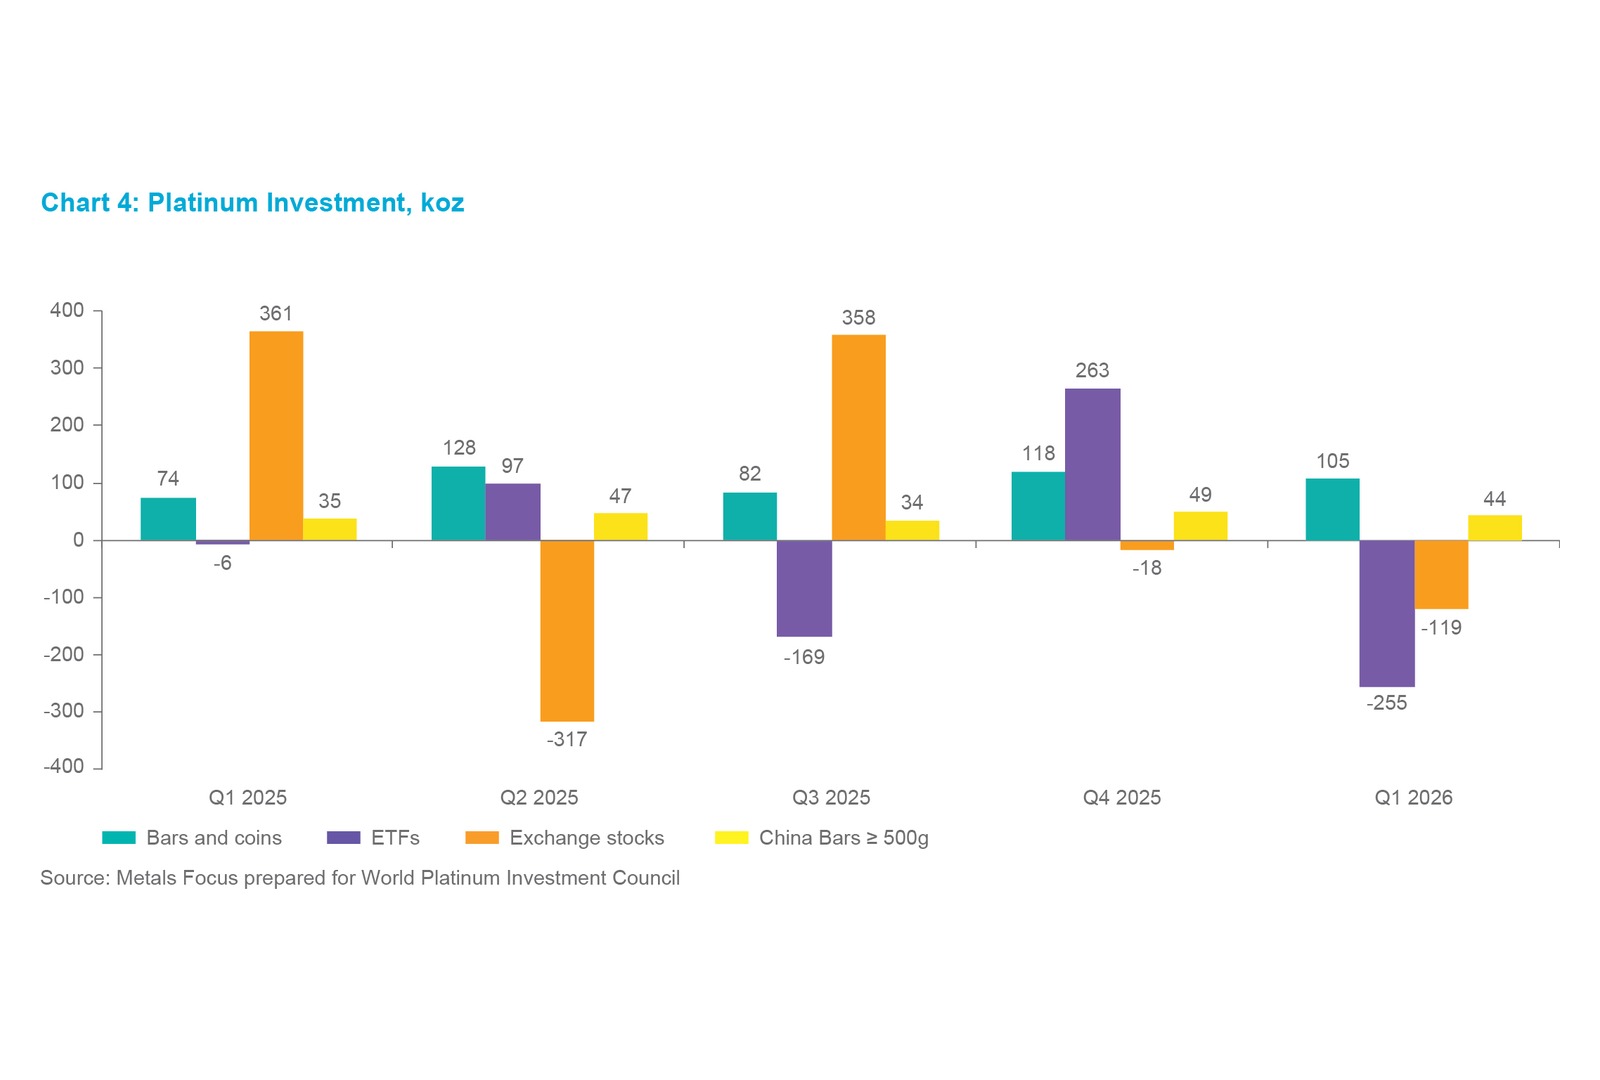
Chart 4: Platinum Investment, koz.
Source: Metals Focus prepared for World Platinum Investment Council

Chart 5: Supply-demand balance, koz, 2014-2026f.
Source: SFA (Oxford) 2014 – 2018, Metals Focus 2019 – 2026f
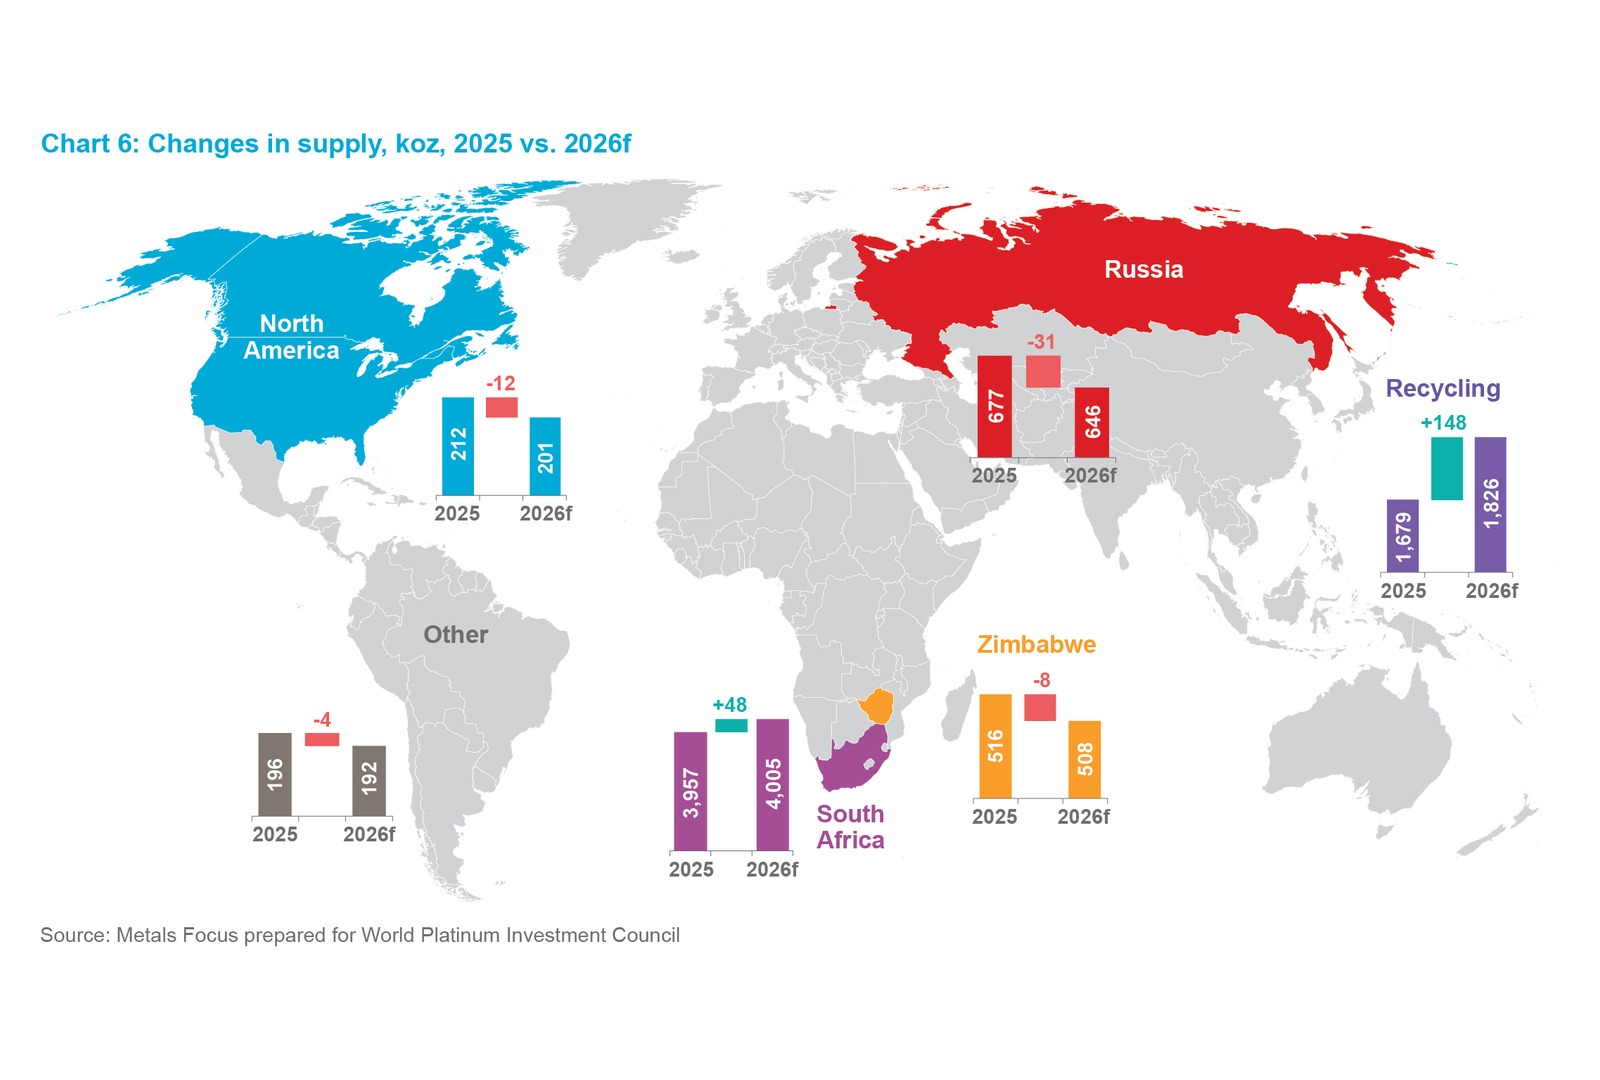
Chart 6: Changes in supply, koz, 2025 vs. 2026f.
Source: Metals Focus prepared for World Platinum Investment Council
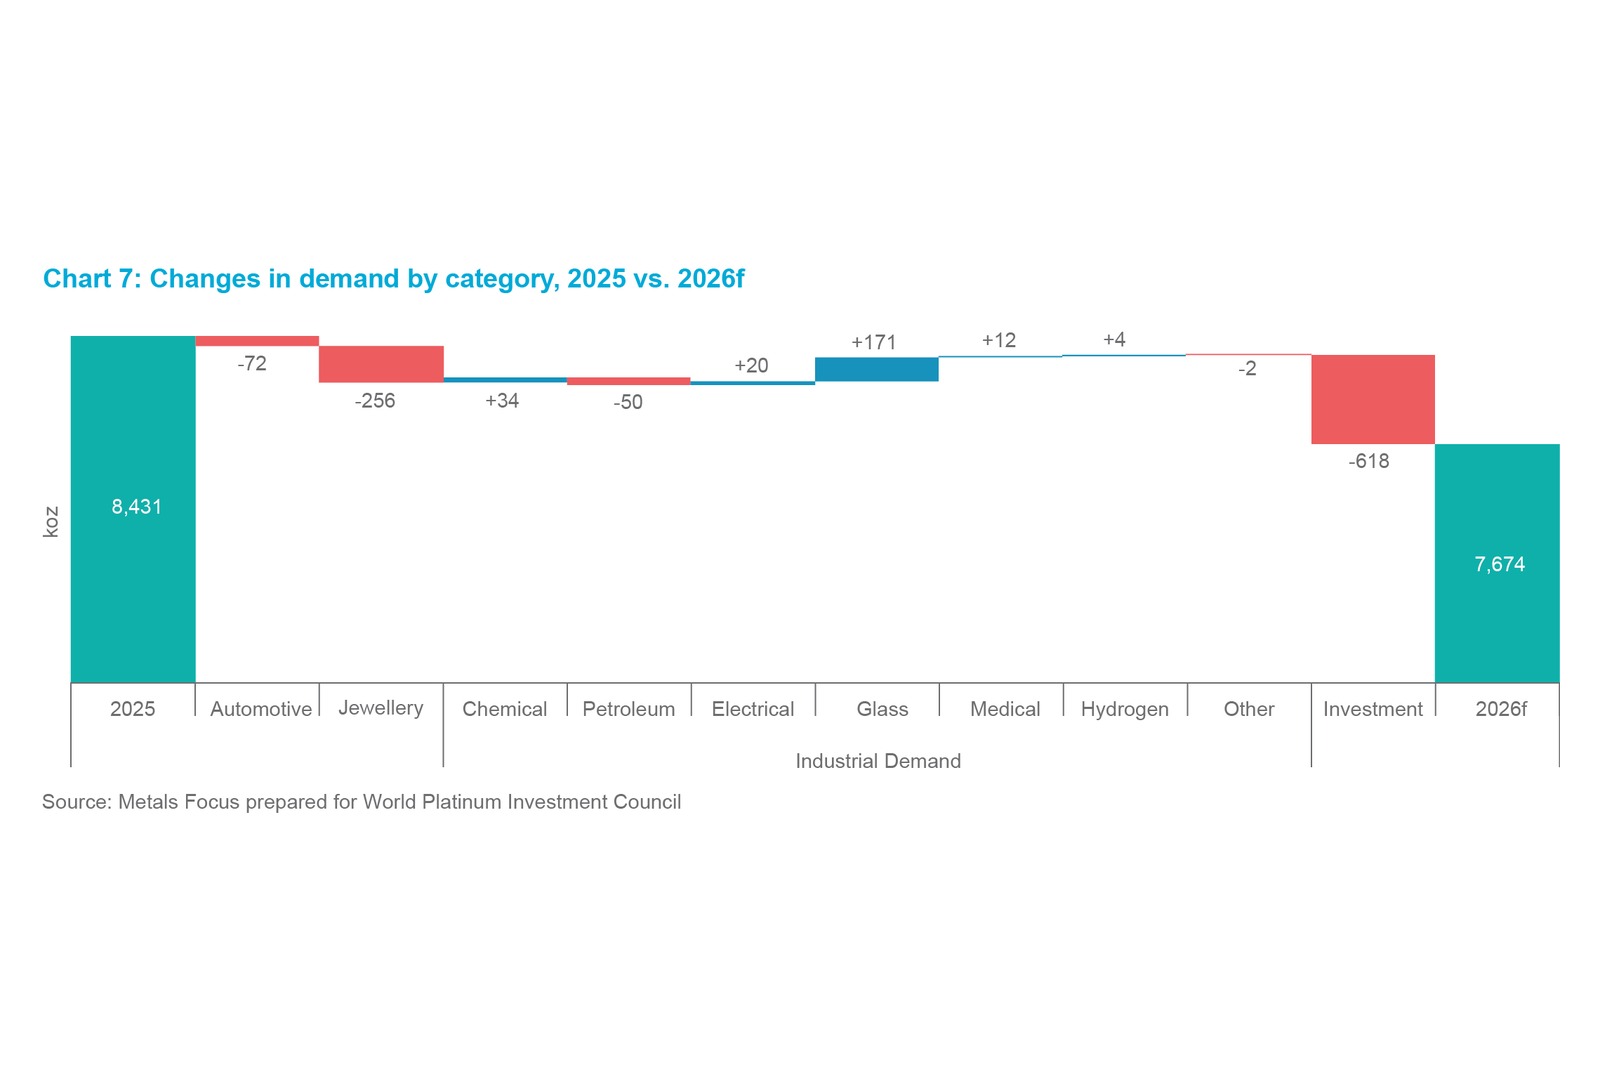
Chart 7: Changes in demand by category, 2025 vs. 2026f.
Source: Metals Focus prepared for World Platinum Investment Council
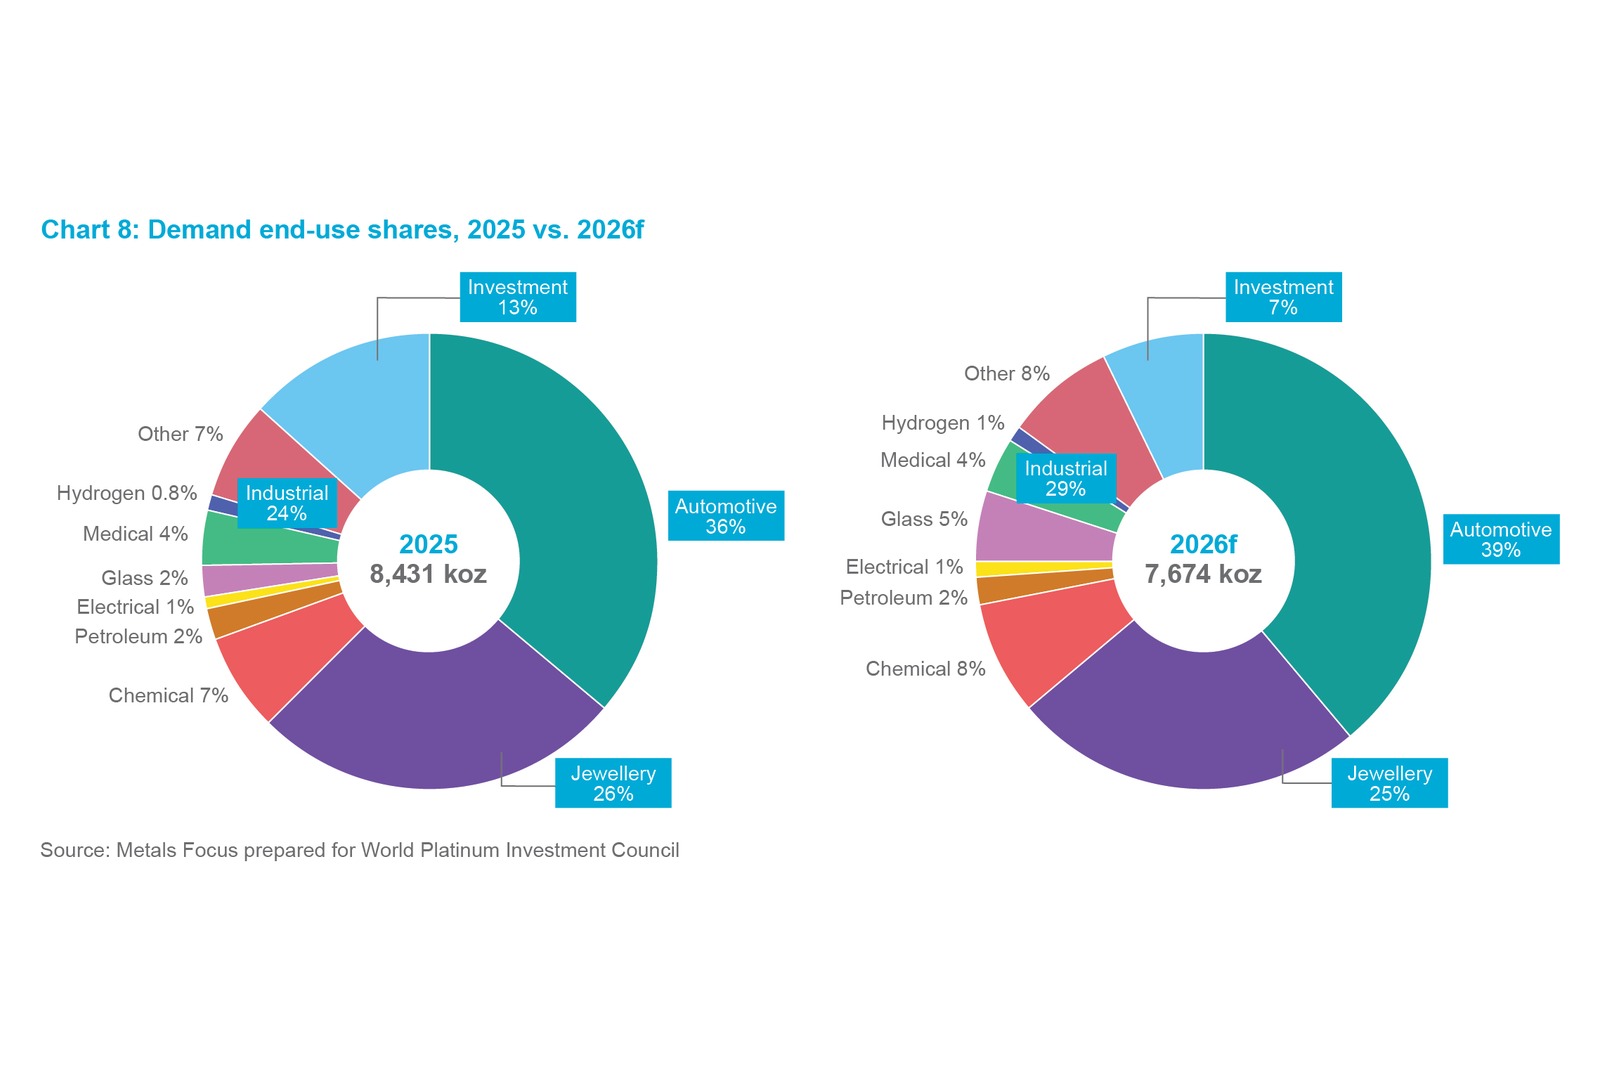
Chart 8: Demand end-use shares, 2025 vs. 2026f.
Source: Metals Focus prepared for World Platinum Investment Council